
الطب والعلوم الصحية

الهندسة والحاسبات

العلوم الإدارية والإنسانية

عمادة التعليم الإلكتروني والتعلم عن بعد
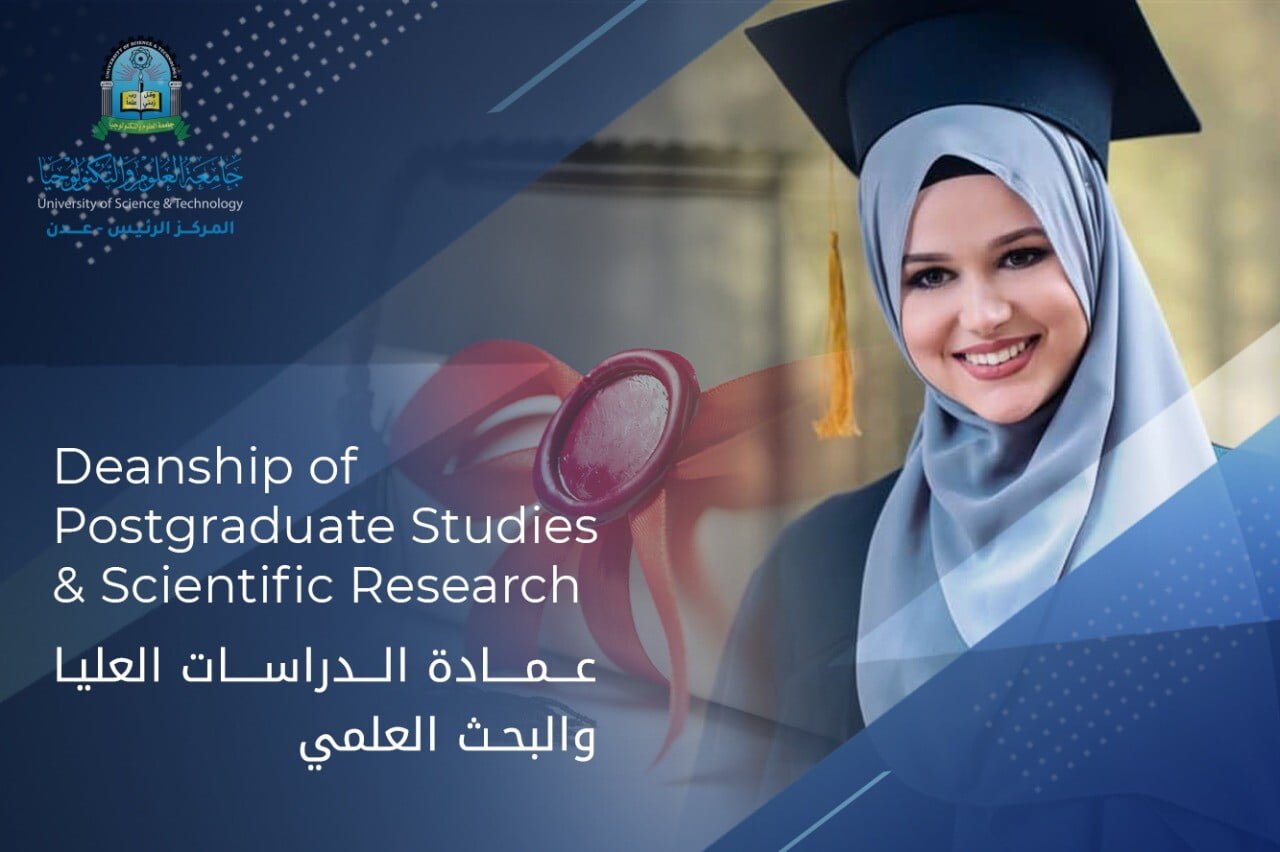
عمادة الدراسات العليا والبحث العلمي
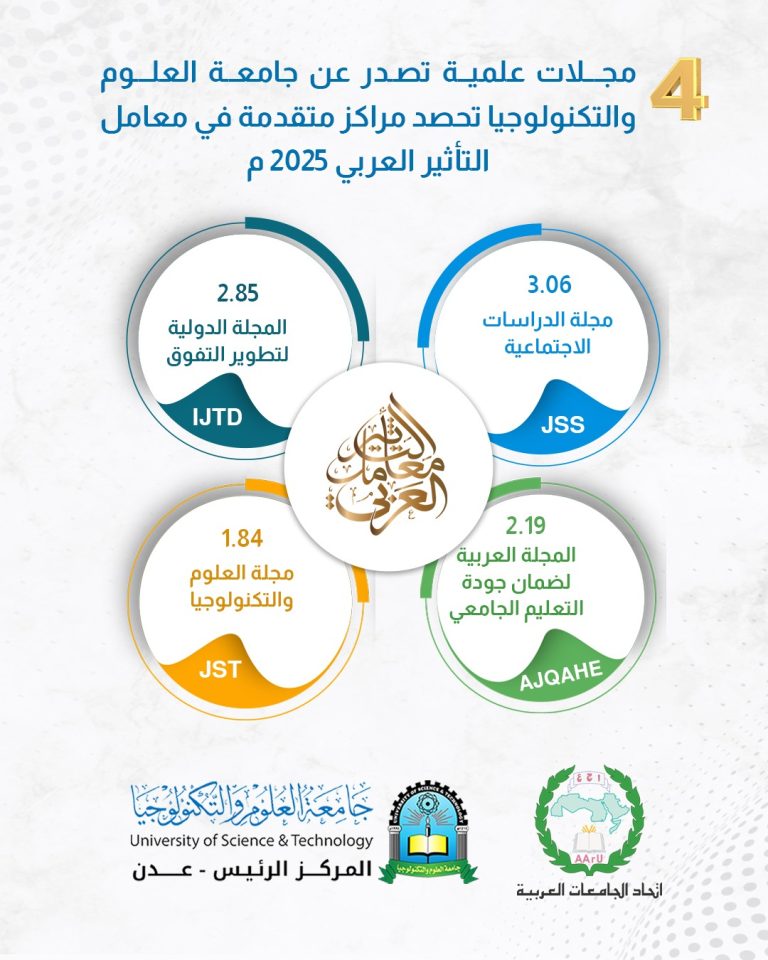
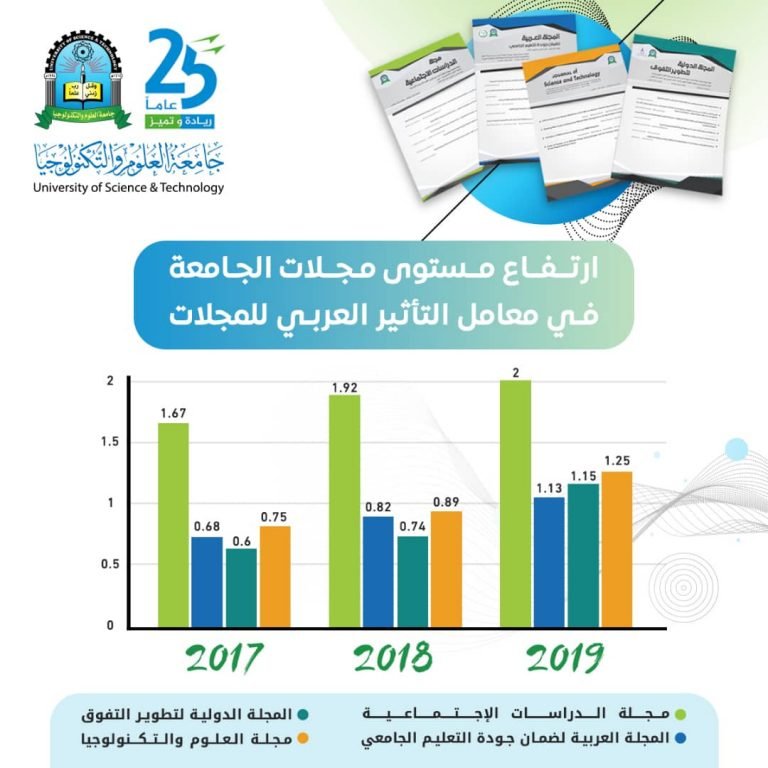

المجلة العربية لضمان الجودة
معامل التأثير : 2.19

المجلة اليمنية للعلوم الطبية
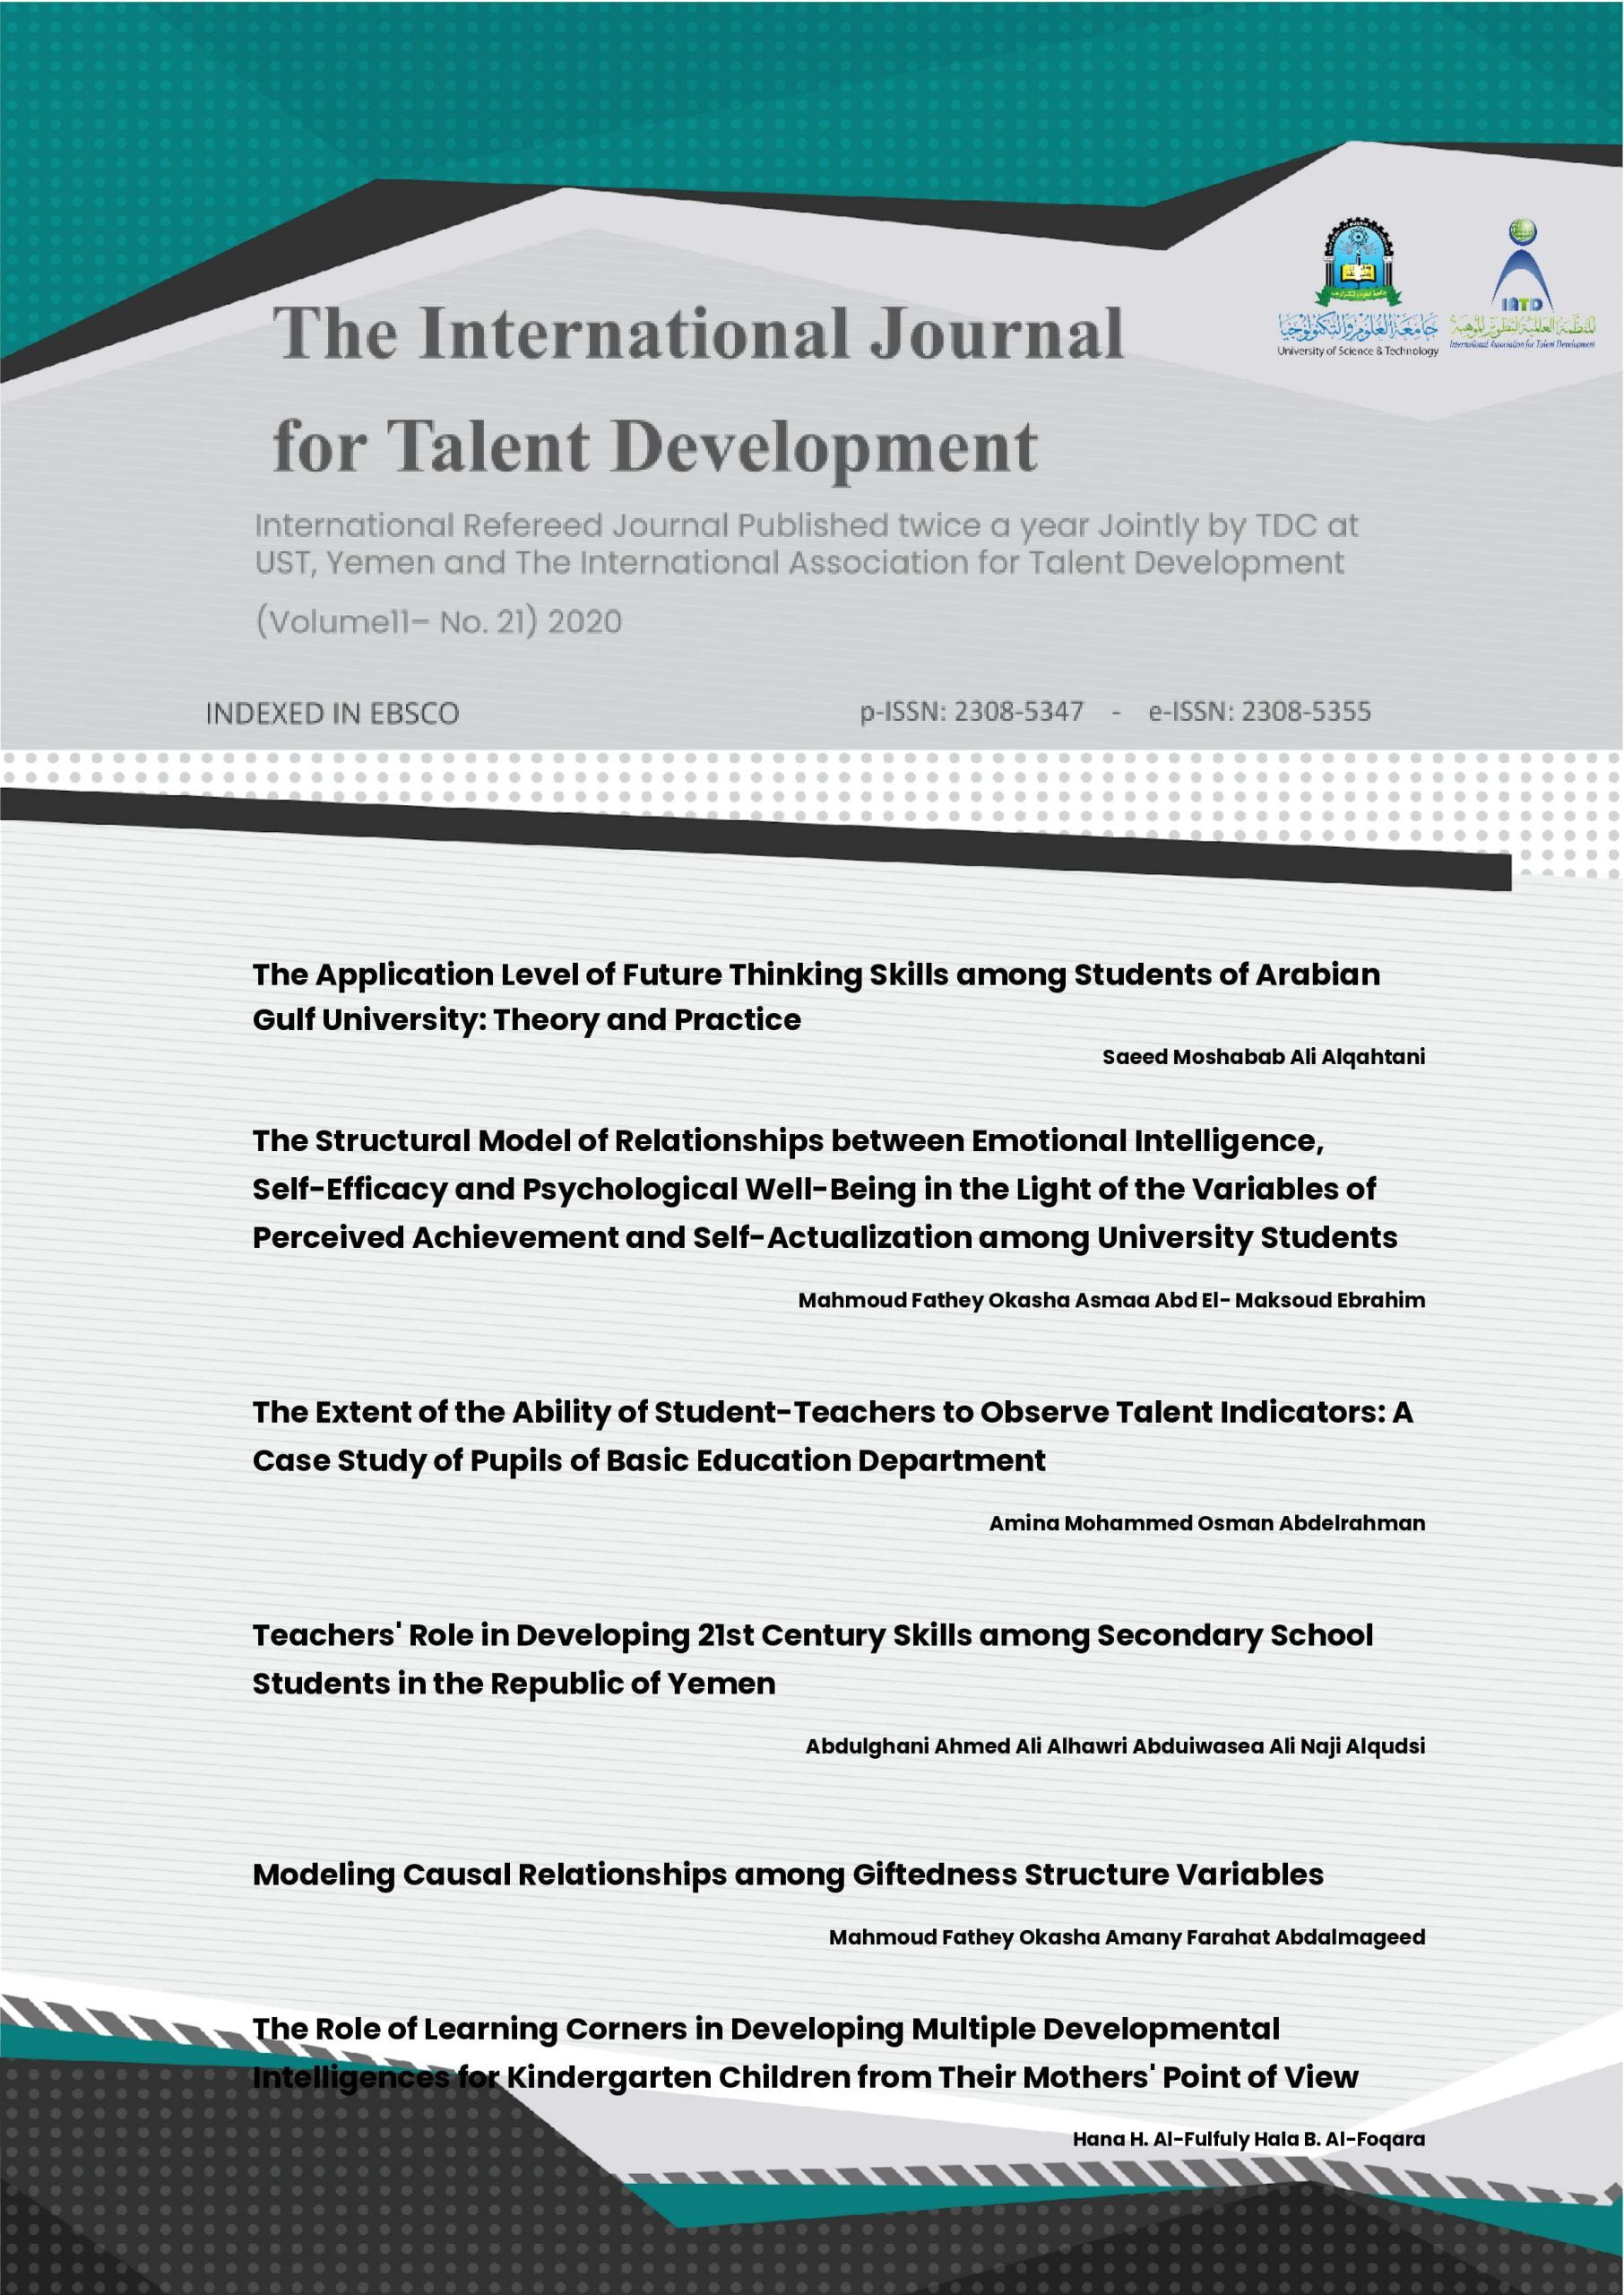
المجلة الدولية لتطوير التفوق
معامل التأثير : 2.85

مجلة العلوم والتكنولوجيا
معامل التأثير : 1.84
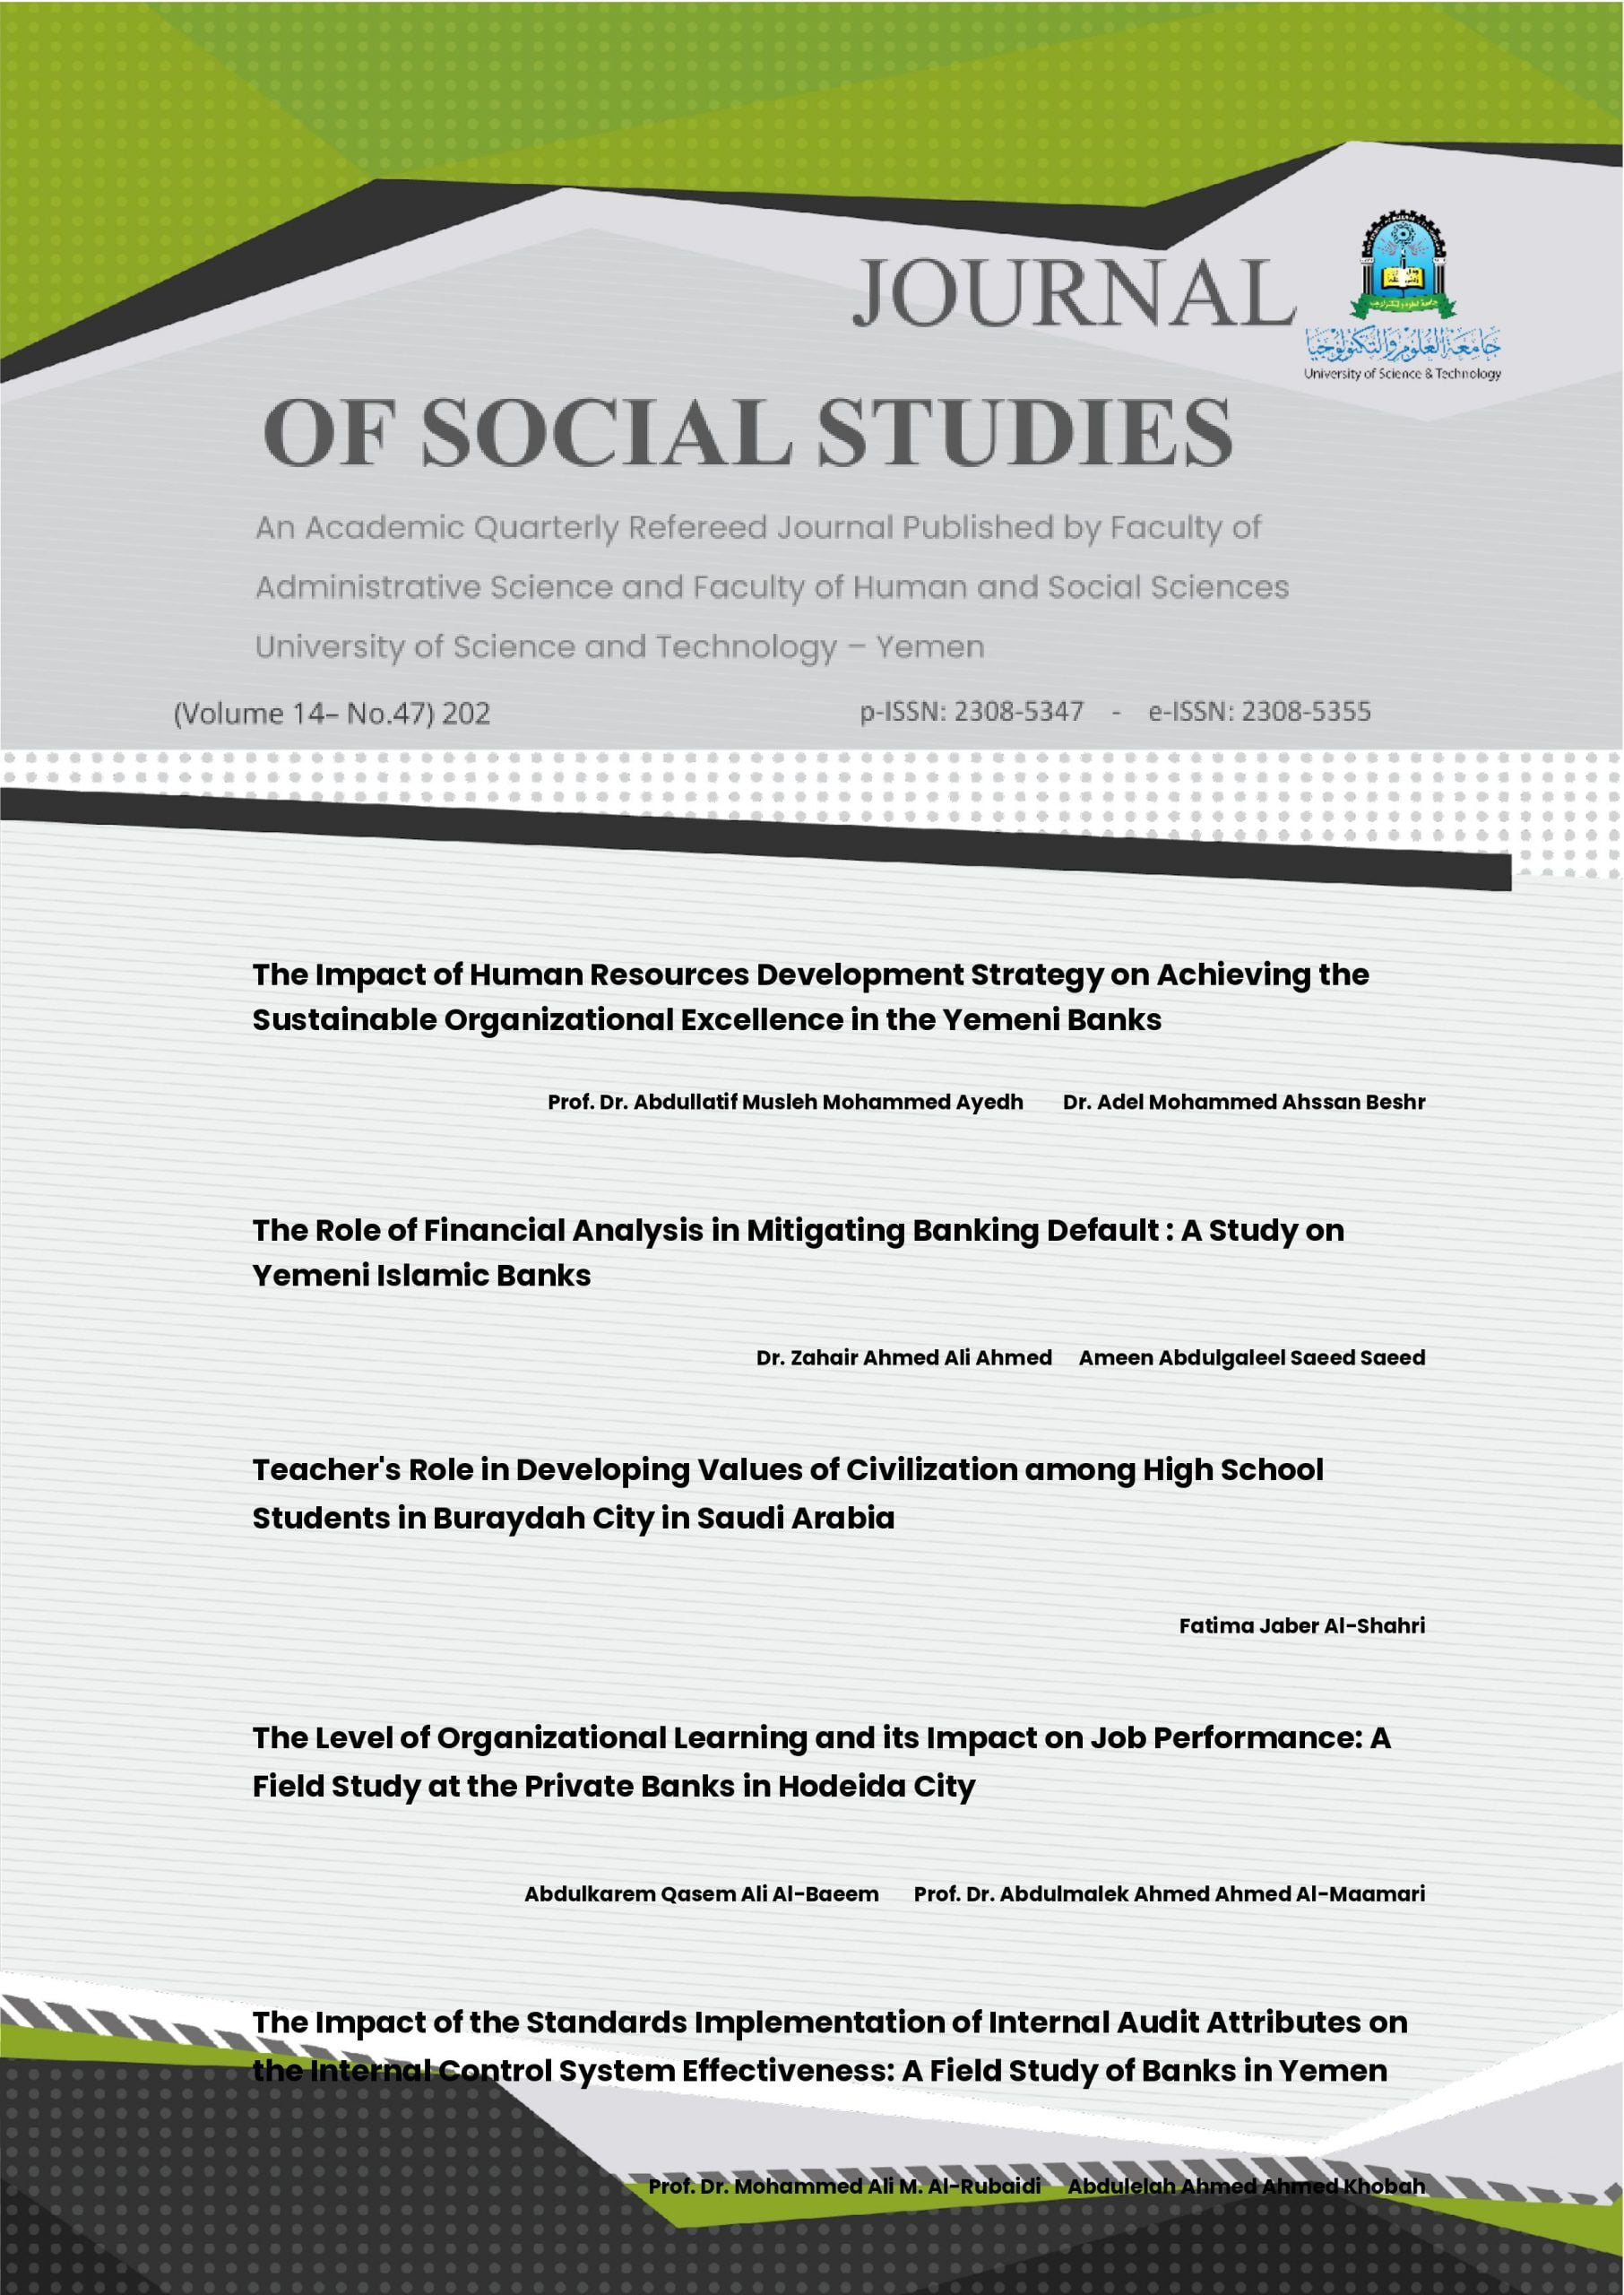
مجلة الدراسات الاجتماعية
معامل التأثير : 3.06

جامعة العلوم والتكنولوجيا – عدن تعزز ريادتها: الأولى أهلياً والثانية وطنياً في تصنيف «ويبومتركس» 2026
في إنجاز أكاديمي جديد يضاف إلى سجلها الحافل بالنجاحات، واصلت جامعة العلوم والتكنولوجيا- المركز الرئيس عدن، تأكيد حضورها الريادي في

تعزيزاً للشراكة المجتمعية.. جامعة العلوم والتكنولوجيا تستقبل طلبة مدرسة النهضة العلمية بسيئون
في إطار دورها المجتمعي وحرصها على دعم العملية التعليمية وتوجيه طلبة الثانوية نحو مستقبلهم الأكاديمي، استقبلت جامعة العلوم والتكنولوجيا- المركز

الماجستير للباحث/ محمد منصور أحمد محمد
منحت عمادة الدراسات العليا والبحث العلمي بجامعة العلوم والتكنولوجيا – المركز الرئيس عدن درجة الماجستير للباحث/ محمد منصور أحمد محمد،

البنك المركزي اليمني يناقش التحضيرات النهائية لانعقاد مؤتمر “القطاع المصرفي والتعافي الاقتصادي”
عُقد اليوم في مقر البنك المركزي اليمني اجتماع تنسيقي، ضم ممثلين عن وحدة الصكوك في البنك المركزي، وجمعية البنوك اليمنية


في أجواء احتفائية بهيجة جامعة العلوم والتكنولوجيا – عدن تحتفل بذكرى تأسيسها الثلاثين
أغسطس 14, 24في أجواء احتفائية بهيجة: جامعة العلوم والتكنولوجيا - عدن تحتفل بذكرى تأسيسها الثلاثينبحضور رسمي وأكاديمي مهيب، أقامت جامعة العلوم والتكنولوجيا - عدن، والتي تعد افضل جامعة في اليمن وأحد أبرز…

المخيمات الطبية – استحقاق الرعاية الصحية للجميع
أبريل 30, 24المخيمات الطبية - استحقاق الرعاية الصحية للجميع تحتلّ المخيمات الطبية مكانة مهمة في منظومة العمل الإنساني، حيث تقدّم خدماتها للفئات المحتاجة في المجتمع، أو تلك التي تعاني نقصًا في الخدمات…

التعليم الإلكتروني آفاق وتحديات، وتجربة رائدة لجامعة العلوم والتكنولوجيا
أبريل 30, 24التعليم الإلكتروني آفاق وتحديات، وتجربة رائدة لجامعة العلوم والتكنولوجيا اكتسب التعليم الإلكتروني أهمية بالغة لما يمتلكه من مميزات عديدة تسهم في تدعيم العملية التعليمية ومنحها مرونة كبيرة. ونظرًا للتطور التكنولوجي…

التعليم الإلكتروني في جامعة العلوم والتكنولوجيا: توظيف الأنظمة الحديثة والتطبيقات الإلكترونية
يناير 10, 24التعليم الإلكتروني في جامعة العلوم والتكنولوجيا: توظيف الأنظمة الحديثة والتطبيقات الإلكترونية على مدار أكثر من ربع قرن، أثبتت جامعة العلوم والتكنولوجيا ريادتها في مجال تبني وتطوير التعليم الإلكتروني والتعليم عن…

ريادة جامعة العلوم والتكنولوجيا في مجال التنمية المستدامة والتطوير
يناير 10, 24ريادة جامعة العلوم والتكنولوجيا في مجال التنمية المستدامة والتطوير في عالم التعليم العالي والبحث العلمي، تبرز جامعة العلوم والتكنولوجيا (UST) كمنارة للتنمية المستدامة والتطوير. بالتزامها بتعزيز بيئة تساهم بشكل كبير…

جامعة العلوم والتكنولوجيا بوابة المرأة نحو التميز الأكاديمي والمهني
يناير 10, 24جامعة العلوم والتكنولوجيا - المركز الرئيس عدن: بوابة المرأة نحو التميز الأكاديمي والمهني في عالم يتسارع بوتيرة التقدم العلمي والتكنولوجي، تبرز جامعة العلوم والتكنولوجيا كنموذج يحتذى به في مجال التعليم…

برامج التعاون الدولي – جامعة العلوم والتكنولوجيا- المركز الرئيس – عدن
مارس 07, 23برامج التعاون الدولي – جامعة العلوم والتكنولوجيا- المركز الرئيس - عدن انطلاقاً من سعي الجامعة، ومنذ تجاربها الأولى لنيل أعلى مراتب الاعتماد الأكاديمي المحلي والدولي، ولضمان تطابق مخرجاتها العلمية مع…

التدريب الميداني جامعة العلوم والتكنولوجيا – المركز الرئيس -عدن
مارس 07, 23التدريب الميداني - جامعة العلوم والتكنولوجيا - المركز الرئيس -عدن من مُنطلق حرص الجامعة على تأهيل طلابها وإكسابهم المهارات والخبرات، والربط بين المعرفة النظرية والتطبيق العملي، وتقديم الفرصة للطلبة باكتشاف…

الخدمة المجتمعية في جامعة العلوم والتكنولوجيا
فبراير 14, 23الخدمة المجتمعية في جامعة العلوم والتكنولوجيا مقدمة: تتبوَّأ خدمة المجتمع في عالمنا المعاصر مكانة مهمة؛ حيث أصبحت تمثّل مسؤولية ملحّة تقع على عاتق مختلف المنظمات الاضطلاع بها، سواء كانت ذات…


